
What Is Flourish?
Flourish is a plant app that aims to help make plant care easier and tonight we’ll be walking through all our research sessions that we’ve conducted over the past 10 weeks, discussing their major takeaways and the data-driven design recommendations based off of those findings.
Our Goals for this Project are to…
Utilize an IoT device to enhance the UX of our app

Devise an app digital solution to improve the user’s experience of plant-care.
Provide plant owners with accurate information and productive tools to keep their plants healthy and happy.
All of these goals are outlined to help achieve our higher level goal, which is to make plant care easier and enjoyable.
How might we bring about an innovative, positive, and effortless experience with plant care?
With the problem statement in mind, we had formulated our research goal for the term. In UX, our motto is putting the user first.
So, We wanted to …

empathize and understand our users’ plant care journeys
understand their pain points and needs in plant care
deliver data-driven design solutions moving forward
Throughout the term, we conducted several UX Research methodologies as outlined below
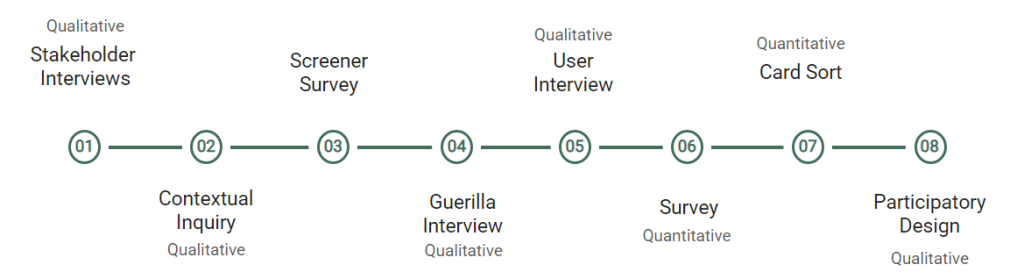
Stakeholder Interview & Contextual Inquiry
We kickstarted our research by interviewing, really, the experts as they have an extensive amount of plant care knowledge that can help us know where to start for our user research.
Stakeholder Interview
We spoke with Pennsylvania Horticultural Society, where we gained a lot of expert plant knowledge such as the major factors of a plant health (light, moisture, temperature, and somewhat fertility), learned some tips such as it’s helpful to learn about the plant’s origin and its natural climate.
Some insights we got from Drexel Urban Grower is that beginners interested in plant care don’t really know where and how to start.
Contextual Inquiry
In addition to gaining further expert-level knowledge and tips, we also gained a better understanding of an expert’s attitude/behavior towards plant care which is considerably different to that of a beginner. We also got exposed to the expert-level tools used such as a humidity sensor and a makeshift greenhouse.
A key takeaway from this initial interview is we realized we do not want to design our app for experts as they are very knowledgeable about plant care, so this helped us narrow our target user to be from beginner to intermediate level.
User Screener Survey
When preparing to conduct user research, it was vital to ensure that the participants who we recruited were truly representative of Flourish’s target demographic. So we conducted a screener survey where the primary characteristics of our target users are digital inclined and interested in plant care. For those that passed the survey, we invited them to our user interviews sessions and sent them the card sort.
Guerilla Interviews
The next form of research we did were the Guerilla Interviews. The benefit of Guerilla interviewing is that it is low stakes for the participants, which means they are not under any pressure of completing a longer interview or survey.
Creating the script also forced us to be decisive about what questions were most important to us at this stage in research, and to find out if our initial ideas of what Flourish should be were going in the right direction.
We did the interviews at Stump in West Philly, then analyzed the data using an affinity map and these were the results.
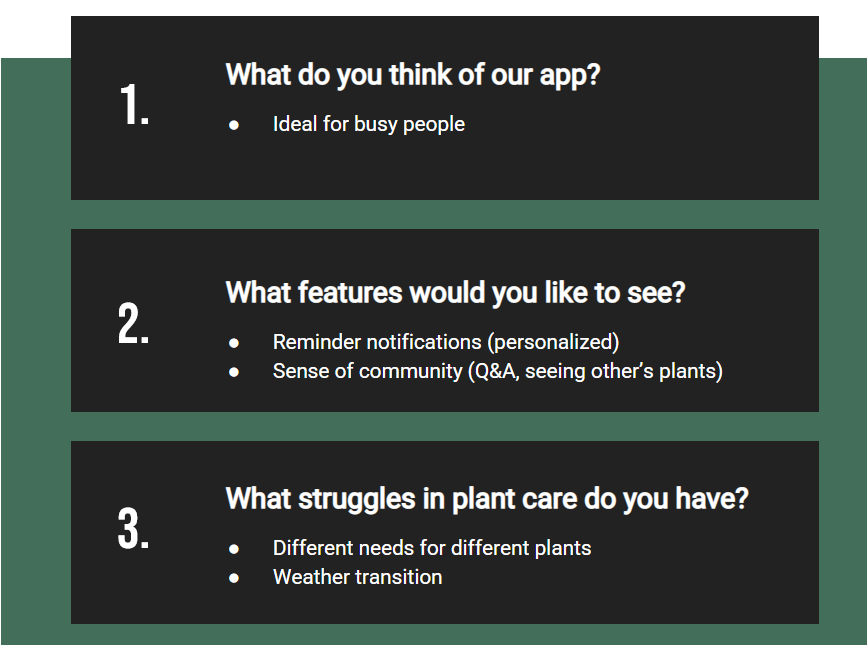
The Three Questions We Asked
User Interviews
On top of our guerilla interviews, we also conducted eight user interviews. The goal of these interviews was to explore people’s experiences and relationships with plant care. We interviewed plant owners who considered themselves to have beginner or intermediate plant care expertise.
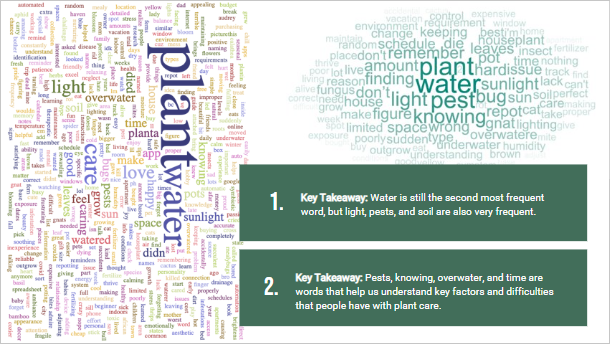
We transcribed all eight interviews and created a word cloud to visualize common themes, and also generated a list of the ten most frequent words.
One interesting insight from this exercise was that water was the second most common word, whereas other variables that our sensor detects such as humidity and temperature were not as common. Another key insight was the overall sentiment of many of the top words such as care, feel, home, good, and pretty have a positive, nurturing connotation.
We also got together and coded each interview, creating an affinity map from our insights.
Overall, most of the people we interviewed were busy working professionals with a lot on their plates and a need for convenience. We learned about a variety of different routines and methods for plant care, and a trend that stuck out was people with a higher skill level and more expertise were more resistant to the idea of using a system that would require them to water their plants or do other tasks on a strict schedule; they had a feel for what each unique plant needs, and as a result, their schedules were looser and more intuitive.
People also used a variety of resources for advice and help, but a common complaint was the lack of a unified source for this information. We see this as an area of opportunity for our app.
Quantitative Survey
Even though we spent over 10+ hours listening to users speak about their plant care journey, we had still set out to launch a quantitative survey through Qualtrics to quickly gain data to understand the context, motivation, and cause of certain elements within plant care ownership. It allowed us to generate a large enough sample of respondents to truly be representative of our target demographic.
The goal was to understand plant owners’ experiences and relationships with houseplants. We were able to branch questions based on key differential factors such as how many plants the respondent currently owned and how they rated their expertise. We focused on finding online forums and groups of plant owners and enthusiasts, as well as those that focused on college students local to Philadelphia. Our survey gained a total momentum of 302 respondents, over half of which responded “yes” to conducting further research.
Next, we will go over a few of the major findings and takeaways.
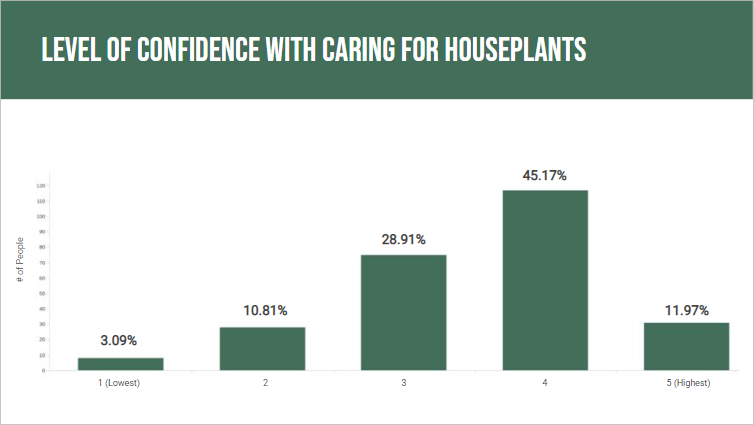
One major finding was that the level of confidence with caring for houseplants were diverse across the board. About 45% of plant owners felt confident in their ability to care for houseplants whereas the other major percentage of 28% of plant owners felt in the middle/neutral / somewhat confident about their abilities with plant care.
This allows us to see the confidence level is scattered, and how the level of confidence isn’t as high as many think. Interestingly, out of over 300 respondents, not many rated themselves as having the highest level of confidence, a 5, which makes the assumption that those could potentially be expert plant owners.
This highlights an area of opportunity to improve people’s confidence and reflects that even experts in plant care are always learning more.
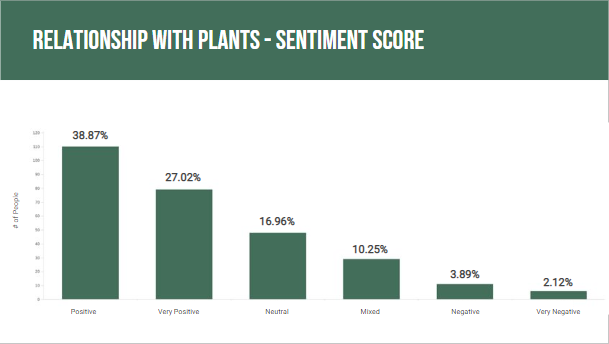
Another major finding was learning more about plant owners’ relationship with their plants. We had asked an open-ended question then generated a sentiment score via Qualtrics to quantify and visualize our qualitative data. It provided us with the ability to understand the emotions of plant owners’ – seeing how many negative responses they had towards plants, what aspects of plant care did they hate, does it align with our assumptions, how could this be improved.
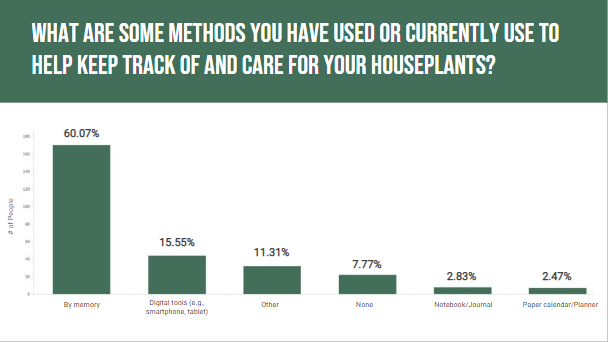
When asked about the methods used to keep track of their houseplants, a vast majority of respondents used memory alone to keep track of caring for their plants. Digital tools came in a distant second. This helped us to understand that the majority of our target demographic isn’t using any tools to track their houseplants – we should target this group with our app as a replacement for memory alone.
This gave us insight on whether or not they use digital organization tools and the extent of it.
Similarly, when we asked about what they found most frustrating about plant care we received a plethora of responses back and was able to sort them using a word cloud. Again, to reiterate more points about how water and pest were mentioned the most.
Card Sort
My team also sent out a card sort to assess the information architecture that would be most intuitive to our users. The card sort can be considered the first step in translating our research into a working design, since our cards were taken from items in our feature matrix that the development team also signed off as feasible. We used screener survey respondents and people from our main survey who indicated that they were interested in further research, in order to guarantee that we were targeting valid members of our target demographic.
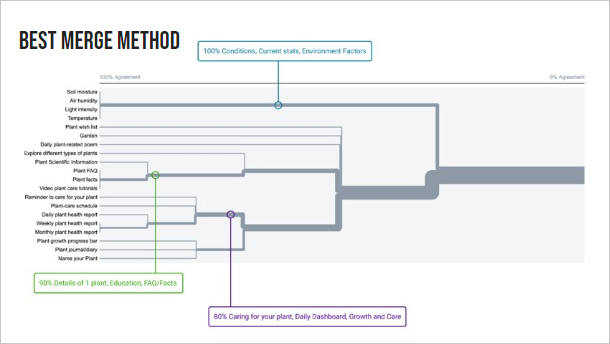
This is a dendrogram of our results, showing the level of agreement that users had about grouping items together. Items that are connected closer to the left show a higher level agreement, and items connected closer to the right show a lower level. The labels are samples of names that different participants assigned to these categories. This dendrogram is not created from factual relationships but instead uses the best merge method, which makes assumptions about large clusters based on individual pair relationships. The best merge method is often more reliable for small sample sizes.
100% of participants agreed to grouping soil moisture, air humidity, light intensity, and temperature, with suggested names such as Conditions, Current stats, and Environment factors. 90% of participants also agreed to grouping a Plant FAQ, plant facts, plant scientific information, and Video plant care tutorials. Some names suggested for this include details of one plant, education, and FAQ/facts. 80% of respondents grouped reminders to care for your plant, plant-care schedules, daily, weekly, and monthly health reports. These were combined into suggested categories such as caring for your plant, daily dashboard, and growth and care.
We are able to use these categories as a basis for our sitemap, as well as the suggested labels.
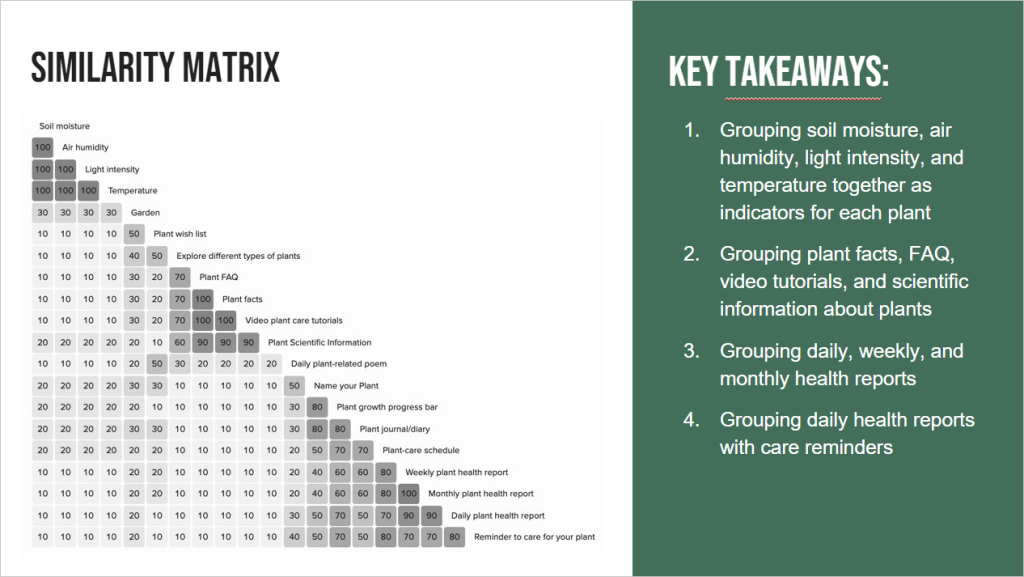
Here you can see another visualization of our card sort data with a similarity matrix. Our key takeaways from this exercise were grouping the conditions our sensors will detect, creating a centralized explore page for plant education, Grouping daily, weekly, and monthly health reports, and combining daily reports with care reminders and instructions.
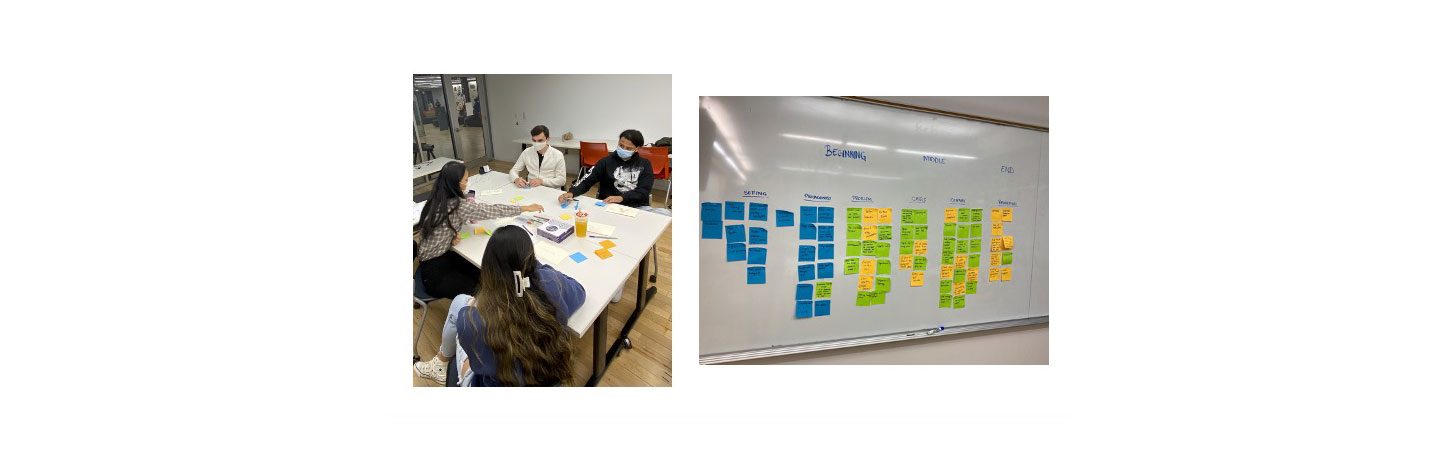
Participatory Design
Once we have gathered an intensive amount of rich user data, we felt confident enough to start the ideation stage. But even for the ideation stage, we started with involving the user first in a participatory design workshop. We conducted this session by uniting users together and working as a team to generate ideas to a user scenario and learn the underlying needs and motive for each idea.
It was a great hour and a half long session where we got a lot of insight into who the potential user of this app would be, what issues would arise, and what sort of solutional ideas would be helpful to combat those issues.
After going through the session of generating ideas, we moved onto doing a Crazy8 session where we encouraged our participants to draw out the ideas they have fresh in mind. This is beneficial as it help us understand how they see the app being used and what sort of mental model they have, and also acts as an inspiration for the UI design of our wireframe.
Some interesting ideas we saw is that in all of them, users have drawn out how to communicate different water needs during different seasons, in the further right sheet, a user wrote down a notification saying “Jimmy had too much sun today!” which validates our plant personifying idea. There are also interestingly some hints of gamification as well, which we are actually incorporating in our low-fi wireframes.
So from all of this research, what are our major takeaways and recommendations?
Users Value Convience
We learnt that our target audience are really busy people. For our user interview we have college students, PhD students, business lawyers, a VP of a tech company etc and we hear that their plants die because of the lack of time they have to care for it, or how they would forget because they already have so much work on their plate. We also learnt that researching plant information online is already quite difficult, and they just wished there was a convenient way of accessing the information they need.
With this, some recommendations we have are creating a management schedule in our app that will also have notification reminders, make sure that the user immediately knows what task they have to complete next, and make finding plant care information accessible.
Different Plants Have Different Needs
A major struggle users have expressed with plant care is how different plants have different needs. Some plants need to be watered twice a week, while some plants only once a month. Sometimes user would not know the name of their plants, and that would make searching for plant information difficult already.
As for the recommendation, this is how having our sensor and the individual plant data rendered into the app will be extremely valuable to our user, and our database which will inform the user if the individual health factors (water, light etc) are at the right level or not will help relieve user the burden from searching these often sought after information. In addition to that, to further educate the users on plant knowledge, we have ideas on including small tips on plant care and an educational/explore page within our app.
WATER, WATER, WATER!
Looking at the word cloud generated from our user interview sessions, we saw that the word water was mentioned the most in comparison to other plants need. This just proves how important water is for plant care (of course) and how it should be prioritized when we design our app. Some struggles users have are figuring out the watering schedule, reminding themselves about it, and knowing how much or how little their plant needs water.
In response to this, we have ideas in including a calendar reminding the users about the watering schedule for example, in terms of information architecture, water is the first piece of information we want to prioritize.
Owning Plants Have Manay Benefits
Despite the many struggles of plant care, users still care for plants because of the many beneficial impacts it has on them. Users have expressed how it improved the aesthetic of the house and brings energy and life to their surrounding environment, which in results affects their mood making them feel energized, relaxed, and overall, happy. From our word cloud, we saw that the top 10 words had positive and nurturing connotations such as care and love. We see that those that tend to have a nurturing and caring attitude toward their plants are most positively impacted by their plants.
Some ideas we have from this is personifying our plant by allowing users to give them names and receiving notifications as if the plant is asking for help. This will help them see plants as a living thing rather than a decoration, and connect with them more.
This is a dendrogram of our results, showing the level of agreement that users had about grouping items together. Items that are connected closer to the left show a higher level agreement, and items connected closer to the right show a lower level. The labels are samples of names that different participants assigned to these categories. This dendrogram is not created from factual relationships but instead uses the best merge method, which makes assumptions about large clusters based on individual pair relationships. The best merge method is often more reliable for small sample sizes.
100% of participants agreed to grouping soil moisture, air humidity, light intensity, and temperature, with suggested names such as Conditions, Current stats, and Environment factors. 90% of participants also agreed to grouping a Plant FAQ, plant facts, plant scientific information, and Video plant care tutorials. Some names suggested for this include details of one plant, education, and FAQ/facts. 80% of respondents grouped reminders to care for your plant, plant-care schedules, daily, weekly, and monthly health reports. These were combined into suggested categories such as caring for your plant, daily dashboard, and growth and care.
We are able to use these categories as a basis for our sitemap, as well as the suggested labels.

Here you can see another visualization of our card sort data with a similarity matrix. Our key takeaways from this exercise were grouping the conditions our sensors will detect, creating a centralized explore page for plant education, Grouping daily, weekly, and monthly health reports, and combining daily reports with care reminders and instructions.